Visualizing things is always dramatically cooler than just “knowing” them, and the conditions within an incubator are no exception. Graphing the temperature and humidity over time turned out really cool to see. This is about the only real life example I’ve personally ever come across that looks like a math class. Specifically, both the humidity and the temperature are pretty damn consistently periodic, and they’re pretty close to sinusoidal. Because relative humidity depends on temperature, the graph of relative humidity is very obviously the composition of two functions with different frequencies (the “absolute” humidity and the temperature).
This is mostly a function of a really naive heating and humidifying implementations: heat until a threshold, turn heater off, passively cool until a threshold, turn the heater on, repeat. Same for the humidifier.

That’s all I wanted to show about the humidity, just that it looks like math class.
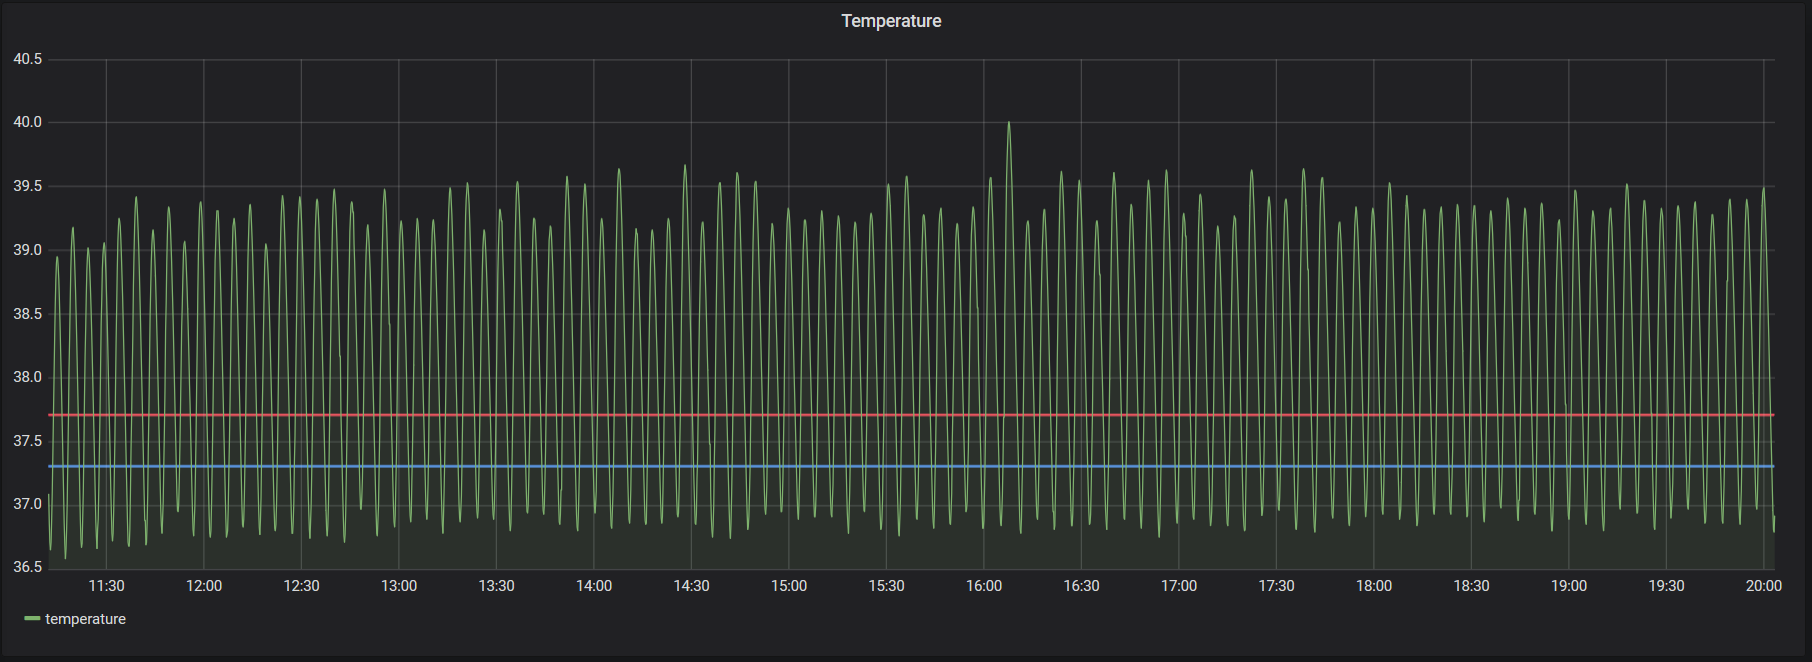
Taking some liberties with the specific values, the heat can roughly be graphed by:
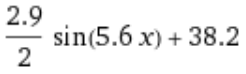
Breaking it down, this means it’s averaging about 38.2°C, varies by ±1.45°C, and has a heat/cool cycle every 5.6 seconds. In terms of an incubator, that’s too hot compared to the target temperature, varies by more than is ideal, and… has a heat/cool cycle every 5.6 seconds. I don’t really know if there are pros/cons to longer or shorter heating cycles, I imagine some middle ground is likely ideal so 5.6s doesn’t seem unreasonable.
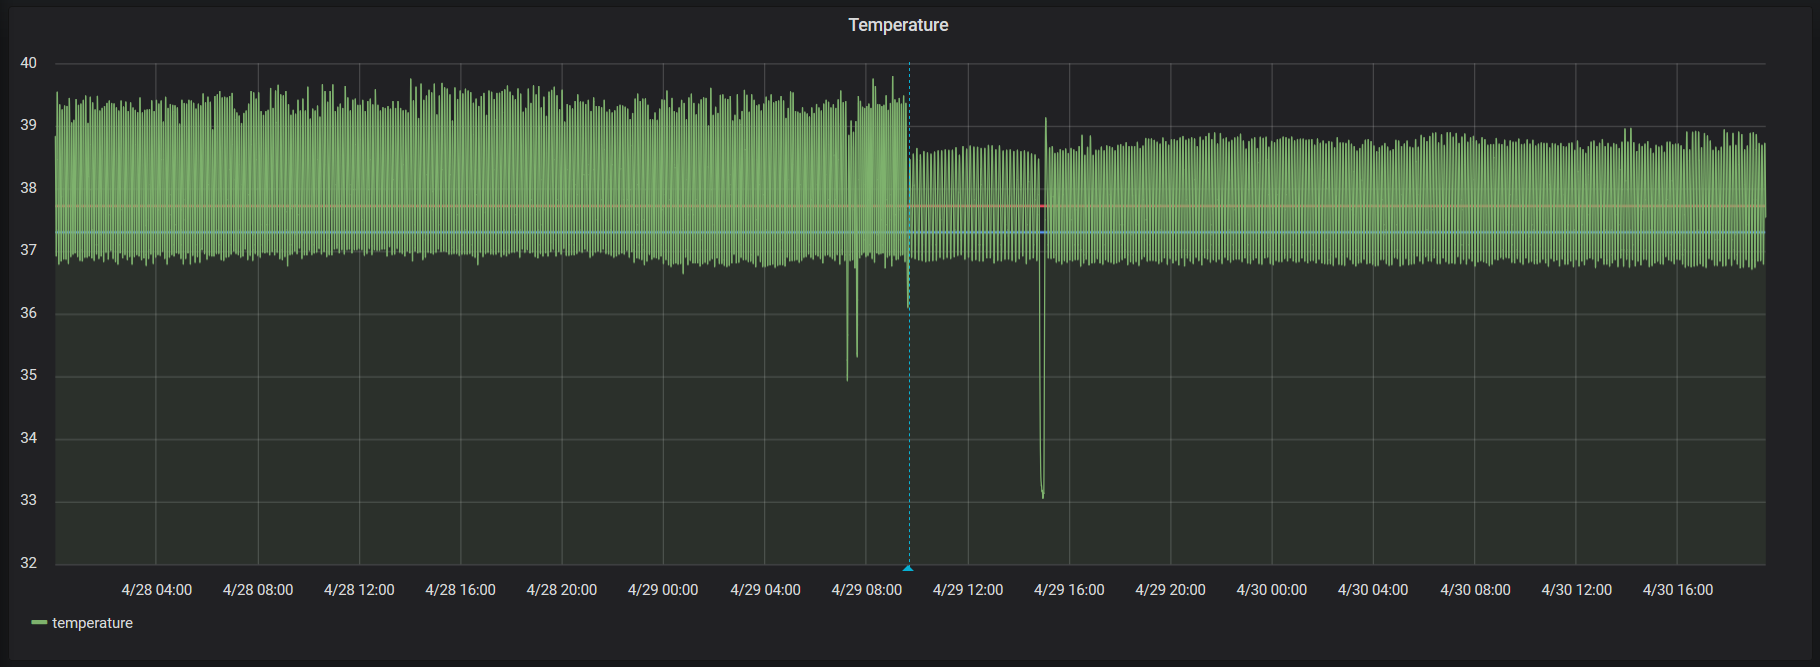
In particular, I’m way overshooting the upper heat threshold as the heater remains hotter than ambient for a bunch of seconds. Rather than solve this the “right” way, e.g. with PID algorithm, I continued to mess around. Aside from changing the heating/cooling thresholds, one of the more interesting things to do is add some thermal mass. I had some preconceived notions that thermal mass was like a battery but for heat.

May be a bit hard to see close up, but it’s quite a bit more clear when zoomed out (ignoring the outliers from me mucking with things). No water jug is on the left, water jug is on the right.
With some more liberties taken with the numbers, the graph of the temperature after adding a jug of water is roughly:
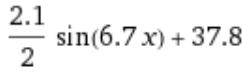
In practical terms:
- now averaging 37.8°C (previously 38.2°C)
- I’m guessing that the thermal mass is “resisting” heating caused by overshooting the threshold, dropping the max temperature reached in the heating cycle
- now varying ±1.05°C (previously 1.45°C)
- this is a great improvement! The incubator spends more time closer to the target temperature
- now has a period of 6.7s (previously 5.6)
- the heating/cooling cycle takes a full extra second now that it’s heating/cooling the water.
- I’m not sure if this is better or worse, seems better that it’s more gradual I guess?
Takeaways
- if you have time series data, graph it! It’s almost always rewarding to see
- all else held equal, a little bit of thermal mass has a dramatic impact
- thermal mass is barely a “battery for heat”
After seeing the impact of the thermal mass, I went back and revisited the concept of “like a battery, but for heat”. While that’s kind of true, it’s pretty misleading. A battery is a battery because it stores a significant amount of energy in a usable form. In terms of the amount of heat stored in thermal mass (how much energy it takes to heat water from the low temperature threshold to the high temperature threshold), one could ask “how long would it stay within acceptable temperature if the power went out” or similar, and the answer is: barely any time at all, on the order of seconds.
By my current understanding, “thermal mass” isn’t really about being a thermal battery so much as it’s about resisting temperature change. Relative to a battery, a jug of warm water has low energy density. Relative to the same amount of air though, it’s incredibly high energy density, and that’s the key.
